Market Risk Management is a complex field that demands, among other things, three fundamental aspects:
- Access to market data – both real-time and historical;
- A good understanding of the applicable valuation models and, above all;
- Available implementations of at least a few of these models.
In addition, these models must be implemented in a user interface system that allows the risk manager to construct several market – and model – changing scenarios in order to quantify the associated impact on the value of the managed portfolio.
Undoubtedly the world’s most used interface system for manipulating numerical data is Microsoft Excel. In my endeavors to keep Risk Management Guru blog up to date, I have decided to search for Excel-based utilities capable of pricing at least the most basic of financial products, such as bonds, options, and swaps. These are also, without question, the asset classes that I favor the most.
Searching on Google for financial derivatives excel, this is what I’ve found:

The two top entries pointed to a site called deriscope.com which I’ve never came across before, but came to realize that this was due to Deriscope being very new, only 6 months in existence. Another pleasant surprise is that Deriscope is license and registration free and supplies real time data, historical time series and a great deal of valuation models.
My First Impression of Deriscope
After downloading the installer from https://www.deriscope.com/freedownload.php and running it locally, the Deriscope Add-In was loaded in my Excel session and the following ribbon item is now available:
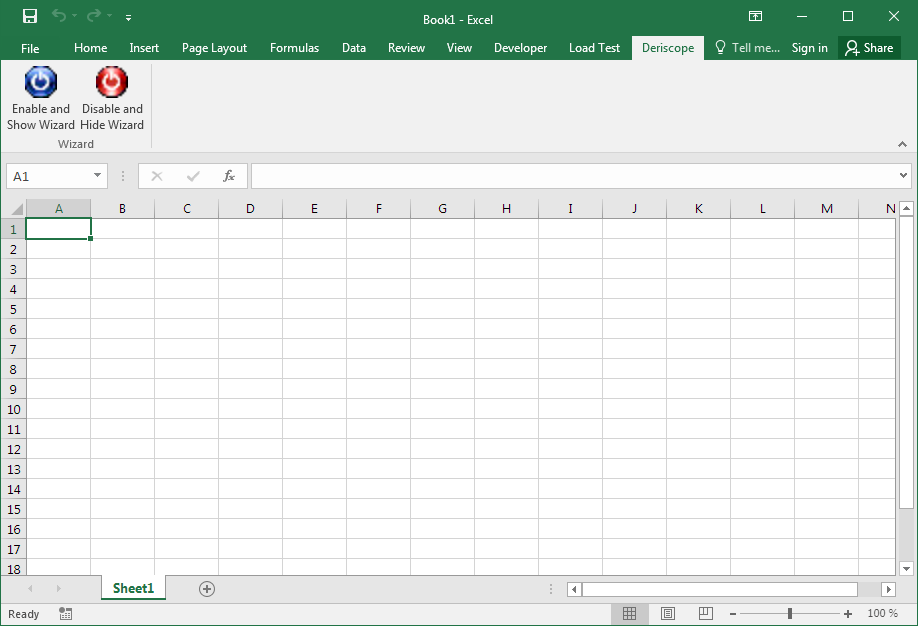
Effectively Deriscope was loaded in a non-intrusive fashion and still allowing me to keep control over switching it on and off through the two blue and red buttons (above).
By clicking on the blue button, a task pane appeared on the right, along with a modal window with a tutor on how to use Deriscope – not bad for a totally free tool with no intrusive ads whatsoever.
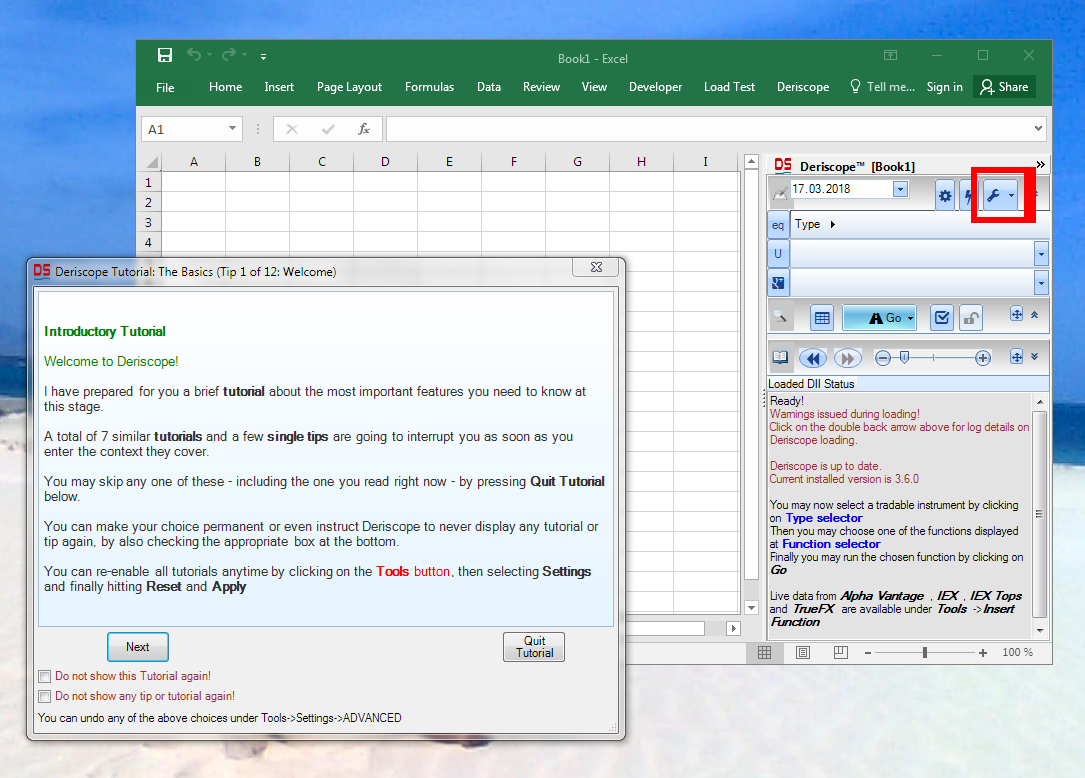
A few minutes later I had a good grasp of what Deriscope was all about and how I could use it to perform various calculations.
Creating my first product
Setting up the spreadsheet formula creating a particular product was both intuitive and straightforward. It took practically one step: Searching within the so-called “Type Selector” for the product’s type and then hitting the “Go” button.
The following short video shows how I managed to create a fixed rate bond in 13 seconds.
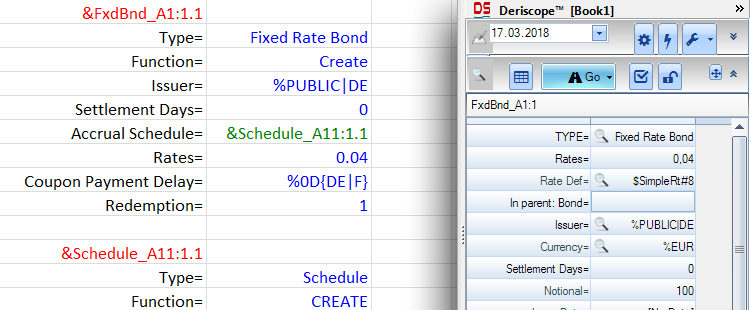
The final result was two spreadsheet formulas, generated by the wizard and pasted in cells A1 and A11, as shown below:
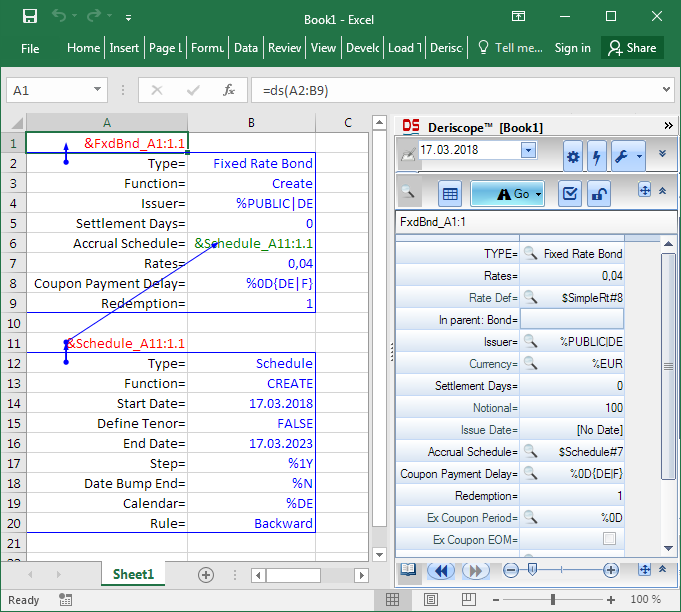
As you see, the formula in cell A1 is =ds(A2:B9) and returns the text &FxdBnd_A1:1.1 in red color, which is what Deriscope refers as the handle name of an object.
The beauty of this solution is that the contents of that object are immediately visible within the task pane as soon as the respective cell is selected, as corroborated by the above screenshot.
Performing my first calculation
Now that I’ve my fixed rate bond, I would like to calculate something about it. Deriscope provides 31 – yes thirty one (!) – different functions that apply to objects of type bond.
I don’t need to worry about typing formulas or what input is required because the wizard can generate the necessary formulas with default input, which I can later overwrite.
The following short video shows how I’ve managed to calculate the convexity of my fixed rate bond in 12 seconds.
The final result was one spreadsheet formula, generated by the wizard and pasted in cell D1, as shown below:
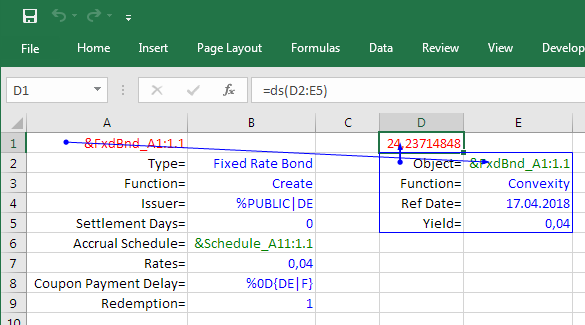
The new formula is =ds(D2:E5) and returns the number 24,23714848 in red color, which is the calculated convexity.
Getting information
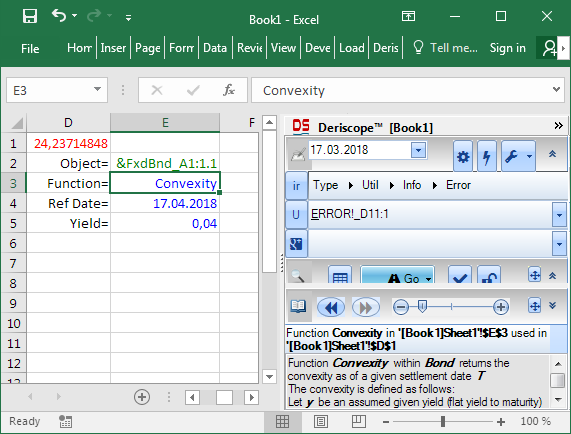
A typical question at this point is: what is the exact meaning of that number? How exactly is convexity defined?
All I need to do is to select cell E3, which contains the word Convexity, and a detailed description appears at the bottom of the task pane, as shown below:
As a matter of fact, I can do the same with almost all spreadsheet cells containing text and thus obtain useful information on input and output data.
Going forward
I came across Deriscope and had the opportunity to play a bit with what looks like a very powerful tool. It is, for sure, very useful for those working on the trading floor and namely with derivative instruments.
Deriscope has many more features waiting to be discovered, such as getting live feeds and historical data in the spreadsheet or the ability through the special Clone function to set up tables with hundreds of rows, where each row produces prices dependent on different instruments, models or market data. This might be a topic of interest to write about in subsequent posts.
Download the spreadsheet
You can download the example described in this article by clicking here.
Please note that in order to replicate the same convexity result you need to set the trade date at the top of the Deriscope taskpane to 17 Mar 2018.
About Deriscope
Deriscope™ is a free Excel Add-In specializing in financial derivatives valuation. Its main innovative feature is an integrated wizard – the first of its kind in the financial industry – that helps you create spreadsheets with real time data (stock and fx live quotes) that deal with the pricing and risk management of diverse types of derivatives such as options, interest rate swaps, swaptions, credit default swaps, inflation swaps, basket options etc.
Follow Deriscope
- Website – https://www.deriscope.com
- Twitter – https://twitter.com/deriscope_com
- Linked In – https://www.linkedin.com/company/27059226/
Stay tuned, I will be writing more about my findings as I progress with Deriscope’s free tool! Please comment below if would like to see more information about a particular asset class or product


