Publicly available market information is not limited in stock prices and historical data. Balance sheets and income statements are also regularly published and can be accessed through certain live feeds providers.
IEX, for example, broadcasts such data that can easily be exposed in Excel using the Deriscope wizard through the appropriate menu selections shown below:

After you click on the Any menu item, the appropriate formulas will be pasted at and below the currently selected cell. For example, if cell A1 is currently selected, the result will be two formulas inserted in cells A1 and A2 as shown below:
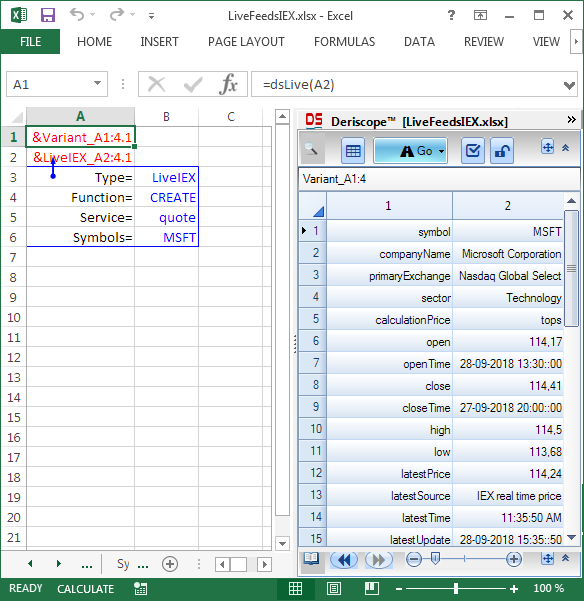
The reason you see this particular output is that the wizard by default has created an object of type LiveIEX in cell A2 with Service= quote, and Symbols= MSFT.
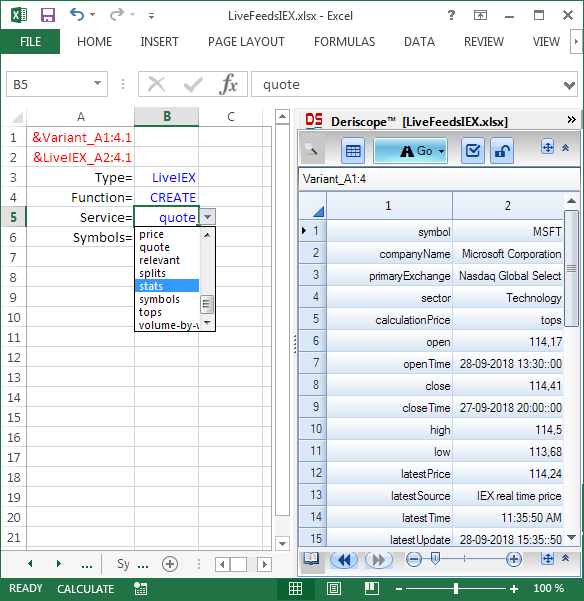
In fact, IEX has 27 different services. You may choose any of them through the drop-down at cell B5 as shown below:
For example, the stats service produces the following result:
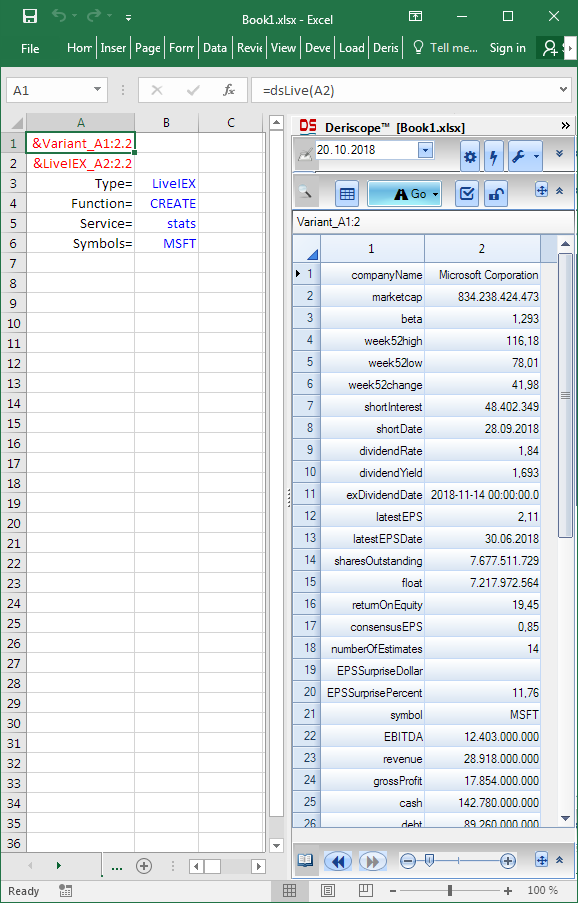
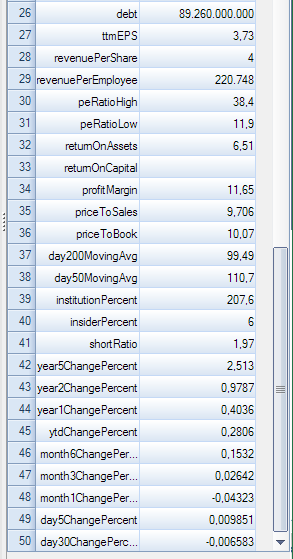
As you see, the wizard is not long enough to display all the data returned by the stats service. Here is the remaining portion, being brought to view by scrolling down:
It is nice to know that so many data are available with regard to the Microsoft stock, but in all likelihood, you would be mostly interested in setting up a table, where each row corresponds to one stock and each column to a certain quantity, such as EPS.
Deriscope gives you the tools to do that. Your first step would be to enter a list of tickers in some column, as shown below, where a few NYSE traded stock tickers are placed in range A9:A19.
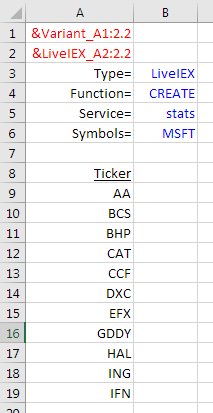
Next to the tickers at column B, you would like to enter formulas that produce the corresponding request objects of type LiveIEX.
There is no reason to use the same formula like the one in cell A2, which creates such an object with respect to MSFT. It is much simpler to clone the existing object of cell A2 and replace its value associated with the Symbols= key with the respective ticker in column A.
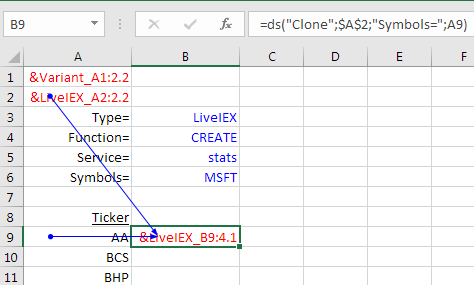
Starting with cell B9, enter the formula =ds(“Clone”;$A$2;”Symbols=”;A9) as shown in the formula bar below:
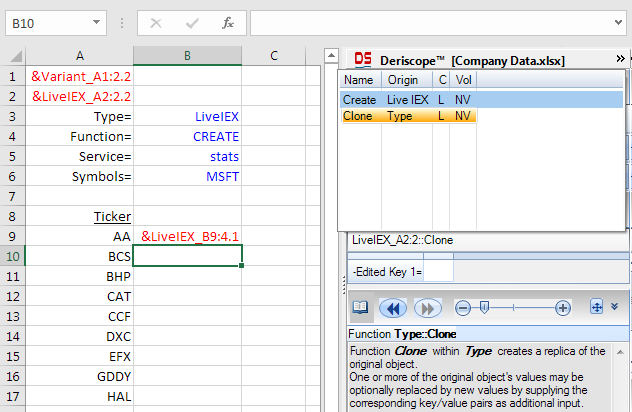
Actually, there is no need to memorize this formula, since it can be also generated by the wizard by selecting the Clone function in the Function Selector, as shown below:
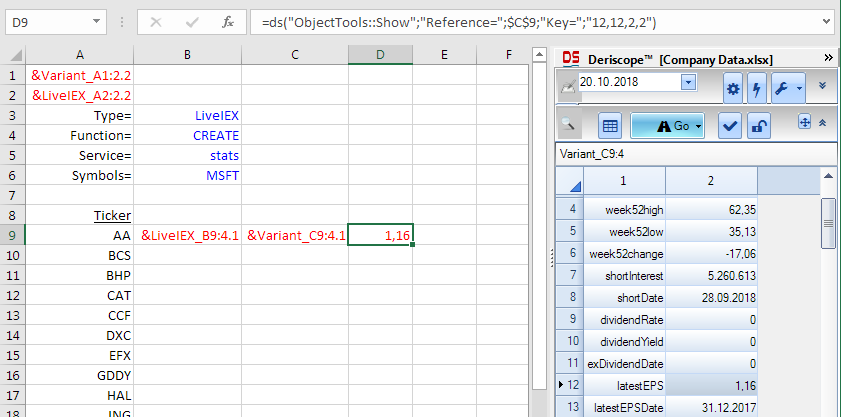
Regardless of how the formula in cell B9 has been created, the next step is to enter the dsLive() formula in the adjacent cell C9, as below:
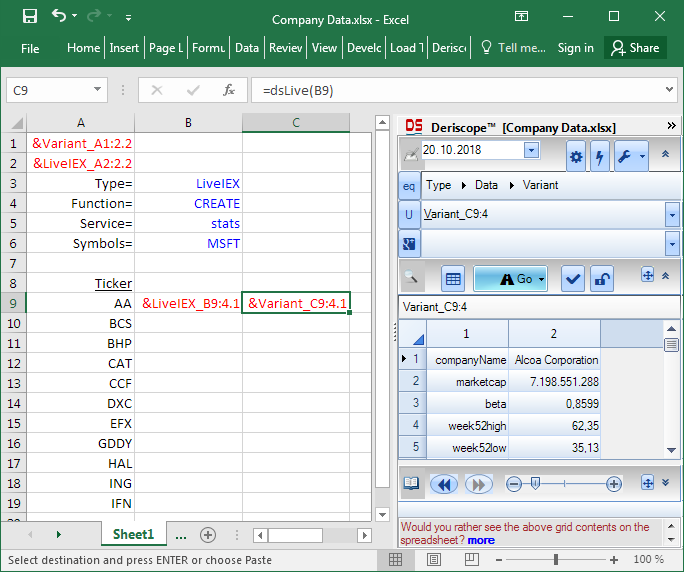
Beautiful! You see already that the contents of the newly created object in cell C9 contain the companyName of Alcoa Corporation, which indicates it corresponds correctly to the ticker AA of cell A9.
The rest is easy. Simply use the Go button to place any values you want in the remaining columns.
As an example, assume you are interested in the Earnings Per Share (EPS). Then first select cell D9 and then search within the Browser Area of the wizard for the EPS value. When you find the desired value, select it and click on Go, as indicated below:
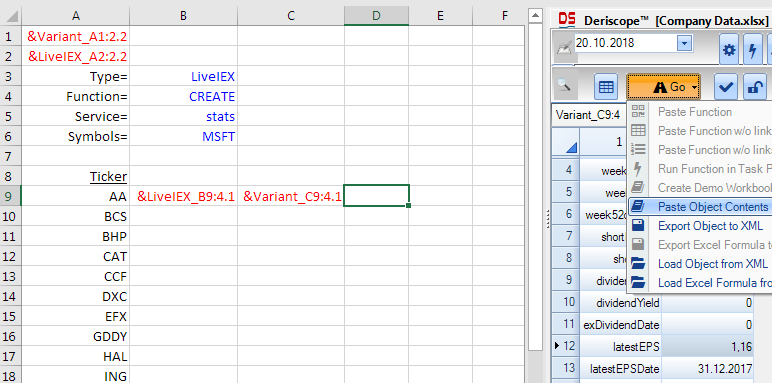
Clicking on Paste Object Contents will generate and paste the appropriate formula in cell D9, which returns the EPS value of 1.16 as shown below:
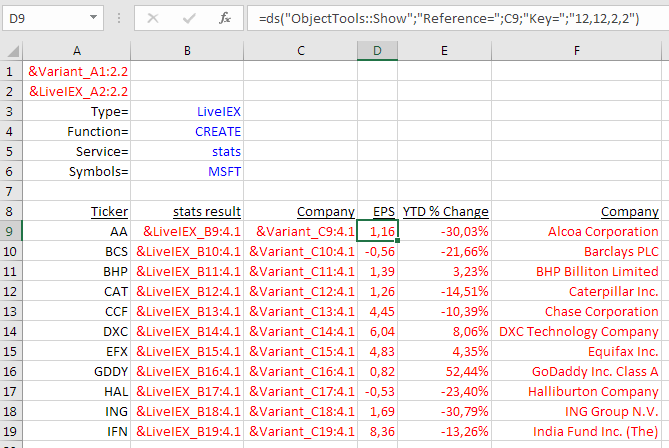
You may continue adding other interesting quantities in the remaining columns.
Following similar steps, you could, for example, paste the formula that returns the YTD % Change in cell E9 and – why not – the formula that returns the company name in cell F9.
In the end, you simply copy and paste all these formulas over the whole range spanned by the tickers at column A, with the following final result, where the titles have been added by hand:
We saw that the IEX service stats publishes 50 different properties for each ticker symbol.
There are other interesting services as well, of which the produced data can be brought to the spreadsheet as described above.
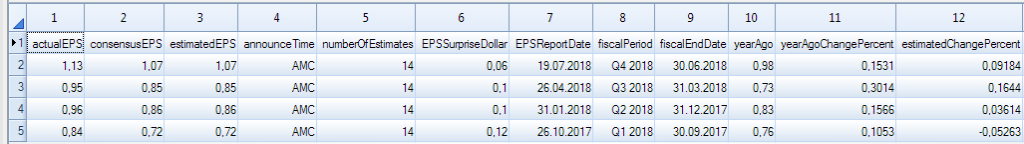
For example, setting Service= earnings, the following quarterly results are produced:
Setting Service= financials, the following additional quarterly results are produced:


