Every single risk management solution relies on the following two prerequisites:
- Realistic assumptions about the equation that presumably describes the evolution of the economy.
- Exact knowledge of the current market state, as this is what defines the starting point of every solution to the evolution equation.
Live market data are in effect the second of these two prerequisites.
Excel is undoubtedly the best platform for performing analysis and stress testing of your risk management models. You may think these types of models are very sophisticated and cannot be easily built in Excel through built-in formulas and Visual Basic code. This is indeed the case, but nothing stops you from accessing these models through Excel, even if they are built elsewhere. Doing so, you will be able to build scenarios and tweak your model parameters in a much more flexible way than from within any other application. Excel is simply way beyond competition in this respect.
Ideally, you would access both live data and predictive models within Excel so that you could add your own fully customized tweaks and switches to both data and models.
While there may exist several methods for accessing live feeds in Excel, we would recommend to use the Deriscope Add-In because it also supports the acquisition of historical prices, company data and – most importantly – is loaded with several pricing and risk management functions.
For concreteness, assume you are interested in real time quotes associated with the following ticker symbols:
MSFT <- Microsoft (NASDAQ)
SIE.DE <- Siemens AG (XETRA)
BNS.TO <- Bank of Nova Scotia (Toronto)
GAZP.ME <- Gazprom (MCX)
6702.T <- Fujitsu (Tokyo)
600999.SS <- China Merchants Securities (Shanghai)
INFY.NS <- Infosys (NSE)
EURUSD=X <- Forex Rate EUR/USD
CL=F <- Light Sweet Crude Oil Futures (NYM)
^DJI <- Dow Jones Industrial Average Index
^FTSE <- FTSE 100 Index
^N225 <- Nikkei 225 Index (Osaka)
Deriscope provides a very simple formula – called dsLiveStartEngine() – that takes a minimum of three input arguments and starts an automatically recurring acquisition of data from the server specified through the first argument. The second argument specifies the update frequency and the third argument the list of monitored tickers.
The following image shows how the formula entered in cell A1 references the column of tickers below it:
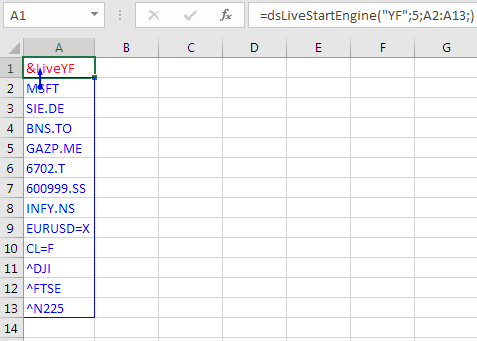
In this case, our data source is Yahoo finance, as betrayed by the letter code “YF” in the first input argument. You can easily switch to a different provider by replacing “YF” with another supported code, for example, IEX. This is particularly handy if one day one of these providers ceases to perform as expected.
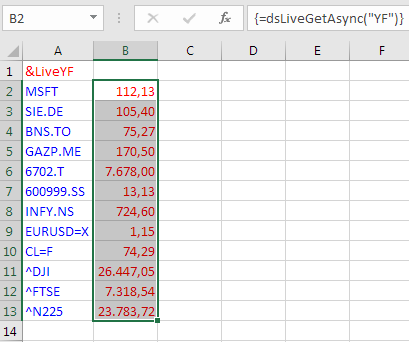
The feeds are received with a 5-second update interval but they are not displayed yet. For that, you need the array formula {=dsLiveGetAsync(“YF”)}, which you can apply on any range you want. In the image below, I have applied the array formula on a column range to the right of my ticker list so that the correspondence between the displayed quotes and the tickers is clear.
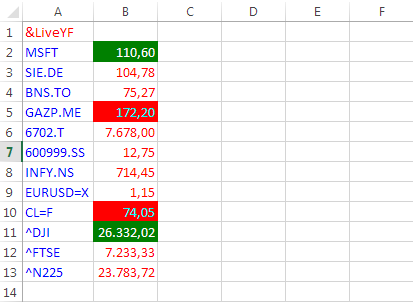
The Deriscope wizard includes a special Auto Refresh button that ignites an automatic recalculation of that array formula so that any new prices will appear as soon as they arrive. As an extra visual aid, prices will flash green if they go up and red if they go down as shown below:
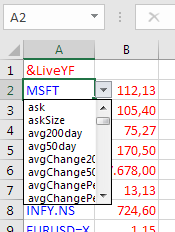
If you want to display other types of data, such as previous close or percentage change, you must add a fourth argument inside the dsLiveStartEngine formula that references a row of fields entered anywhere in the spreadsheet. You can view all valid field names by selecting any ticker-containing cell, for example, cell A2 containing the ticker MSFT, and clicking on the appeared validation dropdown as per image below:
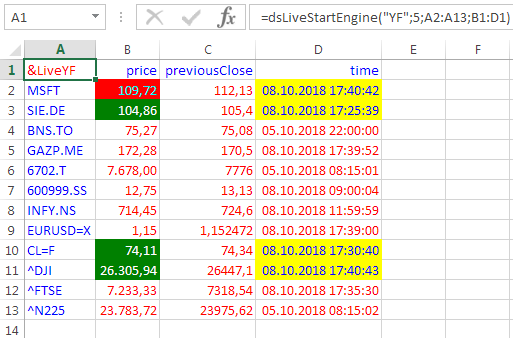
The next image shows the modified dsLiveStartEngine formula in cell A1 that now references the range of fields B1:D1 as well.
The feeds are still displayed by the same array formula {=dsLiveGetAsync(“YF”)}, which now applies to a wider 3-column range.
You do not need to memorize the various formulas. Deriscope includes an integrated wizard that can be used to generate all formulas required for a particular task. This short article provides a quick overview.
For our purposes here, the wizard acts through a taskpane on the right of the Excel window, as shown below:
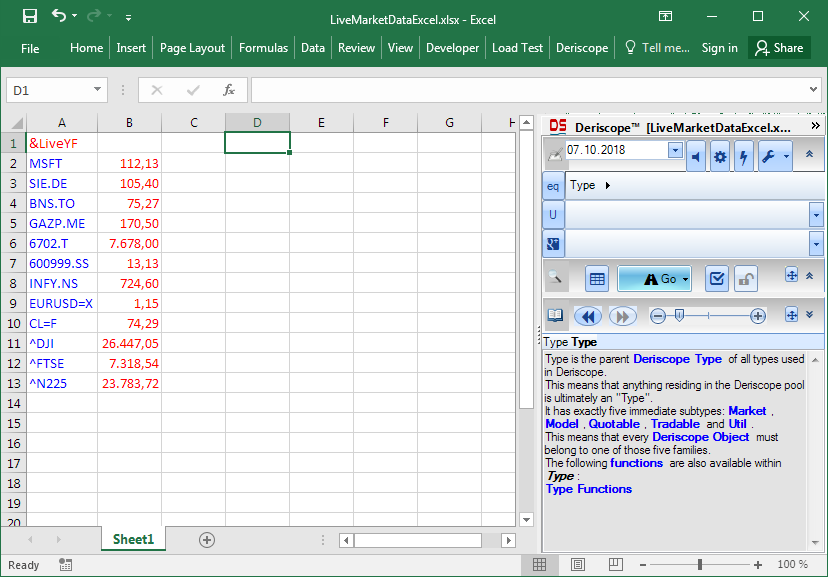
It may look quite “heavy” at first sight, but keep in mind that Deriscope deals primarily with the complex world of derivatives pricing and portfolio management.
You can access the live feeds functionality and indeed paste the exact same formulas we have seen so far, by clicking on the button with the tools symbol and navigating to the final menu item Asynchronous (extended) as shown below:
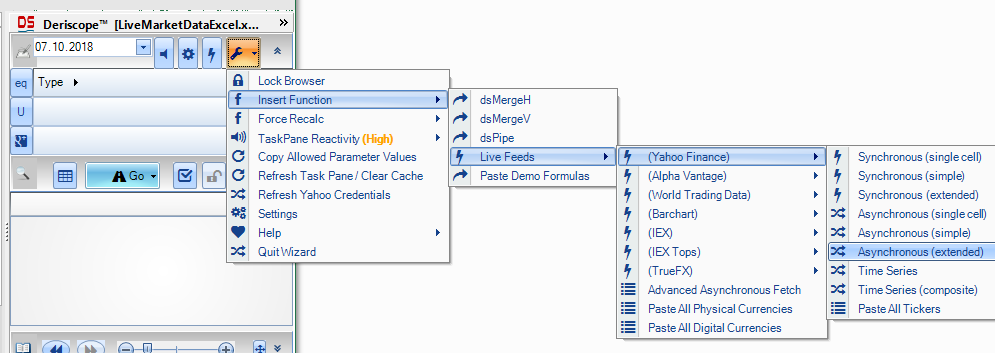
Incidentally, the above screenshot shows the live feeds providers currently supported by Deriscope:
- Alpha Vantage
- Barchart
- IEX
- TrueFX
- World Trading Data
- Yahoo Finance
The features supported by these providers are listed in the following table:
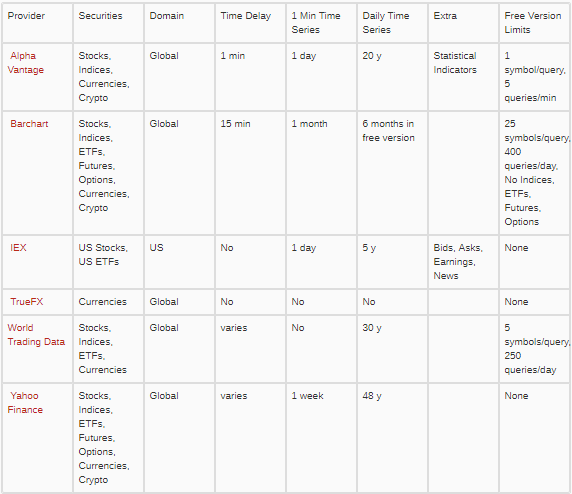
Deriscope supports live feeds from all these providers simultaneously. For example, you can have three dsLiveStartEngine formulas that request feeds from three different sources. The video below shows a continuous loop of a 10-second recording of a spreadsheet when all these feeds keep coming with an update interval of 1 second.
The formula in cell A1 starts the engine with TrueFX and receives bid/ask FX quotes on major currency pairs.
The formula in cell A13 starts the engine with IEX and receives bid/ask price quotes on certain US stocks.
The formula in cell K1 starts the engine with Yahoo Finance and receives last traded prices of various securities.