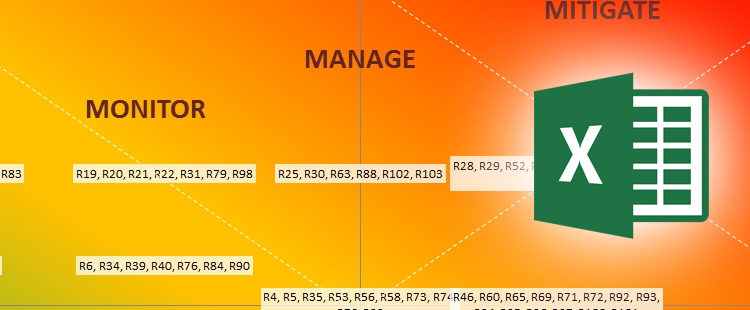
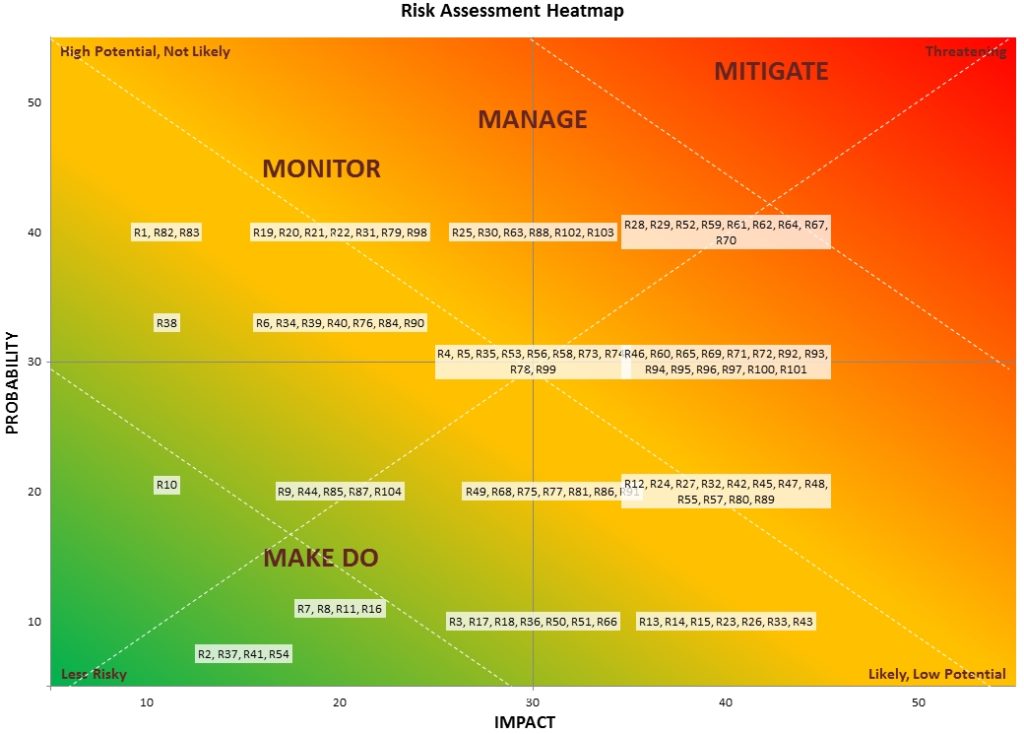
Risk heatmaps are a common tool for many risk managers. A risk map is built by plotting the frequency of a risk on one axis of the chart and the severity on the other. Frequency is how likely the risk is or how often you think it will occur, while severity is how much of an impact it would have if it did occur. The higher a risk ranks for these qualities, the more threatening it is to your organization. You can easily build and modify heatmaps on Excel, as shown in this post.
As risk management tools and systems evolve, however, heatmaps have gained a lot of criticism. They are sometimes viewed as overly simplified, easily manipulated to present favourable scenarios, and even altogether useless as they present no actionable information. However, if heatmaps are used as a stepping stone or one tool out of many, they still have some value. Here’s how to get the most out of your risk heatmap.
Step One – Building a Good Risk Heatmap
The first step to getting the most out of your heatmap is ensuring it’s made properly. This doesn’t only mean that it is built in a presentable fashion with no computational errors; it must also consider all the right risks. Otherwise, the results that come from your heatmap will be poor.
Begin the process by brainstorming a list of possible risks. Depending on if you’re the risk manager, insurance manager, CFO, or frontline employee of an organization, you’re going to encounter different risks and evaluate them differently. That’s why it’s important, during the heatmapping process, to consult with people from across the organization. They may illuminate risks you hadn’t even considered or present an argument on why a risk is more or less frequent or severe. Use this insight to build a heatmap based on an organizational viewpoint, not just yours. This will allow it to be more meaningful to all parties.
If your organization is new, your people may not have the experience or knowledge to accurately assess and rate all risks. In that case, it may be helpful to seek expert guidance. Risk consultants or even insurance providers may be able to provide insight. You can also look at similar organizations or industry trends.
After building a list of risks, you must understand them and your business in order to know their true potential impact. To assess frequency, consider historical data or company experience. How many times has the event happened or almost happened? Severity can be judged based on the event’s impact on your ability to continue operations. A low severity event may cause no disruption, while a high severity one could shut down the organization temporarily or even for good.
Be sure to rank each risk consistently in terms of frequency and severity. Do so comparatively; this is another reason to build a thorough list of risks before beginning to plot points on your heatmap. Use a numeric scale, perhaps from 1 to 10, for each risk on both aspects.
As with any risk management project, building heat maps is not a one-and-done practice. It’s unwise to believe that if a risk is rated low, it will remain that way forever. You must regularly revisit the heatmap, ideally with several members of your team, to determine if anything has changed. Both internal and external factors, such as technology, competitors, and personnel are constantly changing, and risk management practices must change too. Discuss the heatmap at least quarterly to determine if any risks need to be added, removed, or updated in terms of frequency and severity.
Step Two: Use a Heatmap With Other Methods
Heatmaps are, admittedly, very simple tools. To get the most out of one, it should be used in conjunction with other methods.
Some risk managers are turning to more statistical, probability-based methods, such as the Monte Carlo method. Others are implementing formal Enterprise Risk Management frameworks and risk management information systems. These systems automate much of the risk process through data collection and organization, streamlined processes, and reports and dashboards on trends, effectiveness, and other data.
You may think these methods are more useful than heatmaps, and maybe you’re right. But that doesn’t mean there isn’t a time and place for risk mapping. Again, you can use it as a stepping stone to formal risk management that is expanded upon with other tools and deeper analysis.
Step Three: Act Based on the Heatmap
The most critical way to get the most out of a heatmap is to take action based on it. If you simply list your risks, rank them, and plot them on a diagram, the practice would not accomplish much. It’s what you do next that really matters.
To begin, heatmaps can be used as an introduction to risk management for all employees. Traditionally, risk management has been a siloed department within an organization, but today all departments need to get involved. Defining and comparing risks is an easy way to show employees in any area what risks should be on their radar.
You can use heatmaps as part of the basis for formalized risk management procedures. Employees can be trained to follow stated action plans for the most frequent and severe risks, and practice these responses. Then, when an event actually occurs, employees will be confident on how to proceed.
Heatmaps may also be used to obtain buy-in from top management. If the simplification of heatmaps is a drawback, it can also be an advantage. Visual representations are typically quick and easy to understand and share.
After presenting your organization’s most prominent risks, define what you’re going to do about them. It will be easier to think of effective mitigation strategies if you have a working list of risks in front of you. This is the most important step: use the heatmap to define your risk management strategies and goals and monitor their effectiveness. Explain the meaning and potential consequences of each risk and use the map to justify your action plan.
All risk tools can be used as insight for decision making. Managing the risks associated with a large number of rapidly changing factors is difficult, and the use of visual tools can help streamline the process.
One of the best resultant actions of heatmaps is the ability to prioritize risks. If a risk is both frequent and severe, you must try to determine the cause and implement strategies to reduce that risk before any others. Aside from the obvious benefit of reducing the chance of financial or reputational damage, there will also be quick results to deliver to executives on risk management effectiveness. Further, once a risk is addressed and reduced, you can use the map to decide what to tackle next.
Risk teams are very busy and have limited budgets. Heatmaps enable the allocation of these scarce resources. Risks that are both frequent and severe should receive the most attention in terms of employee time and money. Risks that are only high in one factor can receive slightly less attention and resources, and low-risk events can simply be monitored. This ensures you’re tackling the most prominent issues on a day-by-day basis.
Conclusion
As a risk manager, you certainly shouldn’t rely on heatmaps alone to guide your work. However, even as simple tools, they can guide decision making, inspire and explain action, and be one more method of working towards reducing costly risks.
What do you think? What are your preferred tools for risk management?
About Clear Risk Inc
 Clear Risk Inc is a provider of cloud-based risk management software solutions. ClearRisk has 12 years experience helping customers streamline tasks and focus effort on high-value initiatives. Today, ClearRisk works with over 150 organizations across North America in both public and private sectors. Click here to know more about ClearRisk.


