Excel is undoubtedly the best platform for performing custom tasks on your stock portfolio, such as generating performance charts with respect to non-standard quantities.
Generally you would rather base your trading decisions not only on past and current share prices, but also on mathematical quantities calculated out of those prices, broadly known as Technical Indicators. While most trading platforms and risk management utilities normally provide a few Technical Indicators, they won’t be able to address all your needs.
For example, you might want to know the real time value of RSI (Relative Strength Index), a very popular Leading Indicator (a subclass of Technical Indicators designed to lead price movements) invented by J. Welles Wilder and featured in his 1978 book “New Concepts in Technical Trading Systems”. Bad luck has it that your expensive portfolio management software subscription lacks this particular indicator. Nothing is lost, if you know how to work with Excel. Just enter the current and past prices of the monitored stocks in some spreadsheet range and add the formula that calculates the respective RSI value. Nowadays you can find the formula for every Technical Indicator with a simple web search.
The only really tricky part is getting current and past market data into Excel.
In this article I will show you how to display real time or almost real time stock prices in your spreadsheet. I will address the easier question of obtaining historical data in a future post.
Real Time Data Using Native Excel Capabilities
Excel 2010 and beyond supports – at least in principle – fetching data from any website through a special menu option called From Web. This is how I access it in my Excel 2016:
After I click on From Web, the following popup window appears:
Next I overwrite the displayed URL with the one I am interested in, choose the desired data section through the little orange arrow and click on Import to bring the selected data into my spreadsheet.
Unfortunately, not all sites react friendly to this approach. If you try, for example, to get the Google stock data from Yahoo Finance using the URL https://finance.yahoo.com/quote/GOOG, you will end up with several script errors and a nasty text output containing words such as “unauthorized”, “missing cookies” etc.
Other websites may be friendlier. For example, the MarketWatch page at https://www.marketwatch.com/investing/stock/live looks like that:
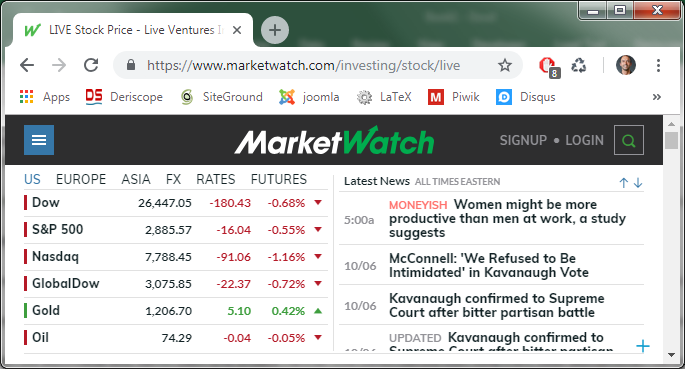
The From Web approach works, but the received data consume 435 rows and up to 5 columns. At least I can reproduce the browser data at row 34 as seen below:
Excel allows you to set up an automatic data download that can be as frequent as one per minute.
A second solution that Excel supports is based on the built-in formula =WEBSERVICE(“some-url-here”).
As an example, you may enter the following formula in any cell to get the real time share price of the Google stock from IEX: =WEBSERVICE(“https://api.iextrading.com/1.0/stock/GOOG/quote/latestPrice”).
Real Time Data Using a Specialized Program
If you are familiar with programming, you may consider writing your own code to access the server of some live feeds provider and bring the data in Excel in a fashion that meets your needs. Chances are though that you would invest your time more prudently, if you employ the services of a third party professional utility.
Most of the applications that are up to the task tend to be quite pricey, perhaps because they often offer features that you do not need. Below I will describe how live feeds acquisition is accomplished by my own creation, an Excel AddIn called Deriscope, which is capable of getting live feeds and historical data from several different providers as well as pricing options and derivatives.
You would normally start by setting up your tickers in one column. Let us assume you are interested in the following:
MSFT <- Microsoft (NASDAQ)
SIE.DE <- Siemens AG (XETRA)
BNS.TO <- Bank of Nova Scotia (Toronto)
GAZP.ME <- Gazprom (MCX)
6702.T <- Fujitsu (Tokyo)
600999.SS <- China Merchants Securities (Shanghai)
INFY.NS <- Infosys (NSE)
EURUSD=X <- Forex Rate EUR/USD
CL=F <- Light Sweet Crude Oil Futures (NYM)
^DJI <- Dow Jones Industrial Average Index
^FTSE <- FTSE 100 Index
^N225 <- Nikkei 225 Index (Osaka)
Some of the above do not represent stock prices, but it doesn’t matter since the same principles apply to all security types.
Deriscope provides a very simple formula – called dsLiveStartEngine() – that takes a minimum of three input arguments and starts an automatically recurring acquisition of data from the server specified through the first argument. The second argument specifies the update frequency and the third argument the list of monitored tickers.
The following image shows how the formula entered in cell A1 references the column of tickers below it:
You can easily switch to a different provider by replacing “YF” with another supported code, for example IEX. This is particularly handy if one day one of these providers ceases to perform as expected.
The feeds are received with a 5-second update interval but they are not displayed yet. For that, you need the array formula {=dsLiveGet(“YF”)}, which you can apply on any range you want. In the image below, I have applied the array formula on a column range to the right of my ticker list so that the correspondence between the displayed quotes and the tickers is clear.
The Deriscope wizard includes a special Auto Refresh button that ignites an automatic recalculation of that array formula so that the new prices will appear as soon as they arrive. As an extra visual aid, prices will flash green if they go up and red if they go down as shown below:
If you want to display other types of data, such as previous close or percentage change, you must add a fourth argument inside the dsLiveStartEngine formula that references a row of fields entered anywhere in the spreadsheet. You can view all valid field names by selecting any ticker-containing cell, for example cell A2 containing the ticker MSFT, and clicking on the appeared validation dropdown as per image below:
The next image shows the modified dsLiveStartEngine formula in cell A1 that now references the range of fields B1:D1 as well.
The feeds are still displayed by the same array formula {=dsLiveGetv(“YF”)}, which now applies to a wider 3-column range.
You do not need to memorize the various formulas. Deriscope includes an integrated wizard that can be used to generate all formulas required for a particular task. This short article by Antonio Caldas provides a quick overview.
For our purposes here, the wizard acts through a taskpane on the right of the Excel window, as shown below:
It may look quite “heavy” at first sight, but keep in mind that Deriscope deals primarily with the complex world of derivatives pricing and portfolio management.
You can access the live feeds functionality and indeed paste the exact same formulas we have seen so far, by clicking on the button with the tools symbol and navigating to the final menu item Asynchronous (extended) as shown below:
********** UPDATE AS OF JUNE 2020 **********
While the above shown wizard is still valid, Deriscope has now a ribbon tab called DeriLive dedicated to live feeds that makes the generation and editing of formulas much easier.
You may visit this live feeds guide for more details. This is how it looks:
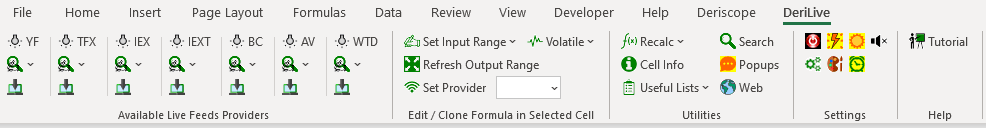
********** END OF UPDATE **********
Incidentally, the above screenshot shows the live feeds providers currently supported by Deriscope:
Alpha Vantage
Barchart
IEX
TrueFX
World Trading Data
Yahoo Finance
The features supported by these providers are listed in the following table:
Deriscope supports live feeds from all these providers simultaneously. For example, I can have three dsLiveStartEngine formulas that request feeds from three different sources. The video below shows a continuous loop of a 10-second recording of my spreadsheet when all these feeds keep coming with an update interval of 1 second.
The formula in cell A1 starts the engine with TrueFX and receives bid/ask FX quotes on major currency pairs.
The formula in cell A13 starts the engine with IEX and receives bid/ask price quotes on certain US stocks.
The formula in cell K1 starts the engine with Yahoo Finance and receives last traded prices of various securities.