As described in section “Risk Register“, once the Risk Management department of a firm (along with the respective business owners or representatives) assesses all its risks and scores their severity according to probability (or likelihood) and impact, it is possible to extract and isolate the top risks an organisation might be exposed to. These can be defined as the firm’s “key risks”.
It is then possible to define specific data which must be collected regularly to measure the ongoing status of those risks. For each KRI, upper and lower acceptable risk limits (warning thresholds) are defined, allowing management to track evolution and trends for each risk and KRI. This methodology enables the usage of Red, Amber and Green (RAG) limits which are useful since a “soft” amber limit can trigger an action before reaching the “hard” red limit.
A solid KRI process brings advantages for a firm, enabling appropriate and precise escalation levels. It also allows a firm to look at how risks are evolving, anticipate any additional risk mitigating control needs and develop comprehensive management information reports for senior management and the Board of Directors. The challenge of KRI usage is revisiting and eventually adjusting the RAG risk tolerance thresholds over time.
On the other hand, an embedded KRI system can deliver distorted outputs over time if responsible staff start adjusting their management approach to their own KRI’s. Hence the need of revisiting and adjusting KRI’s periodically, involving the Risk Management department.
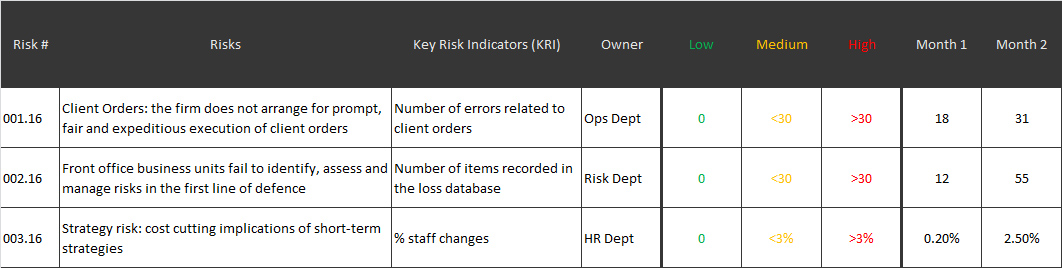
Below you can see an example table containing risks, the defined KRI’s, their respective owners, thresholds for each KRI, and data capture for each month. Depending on each risk’s particular requirements, the captured data for a given KRI timeframe might be different (e.g. hourly, daily, weekly, etc.). – click on the image to view larger version.