Many experts predicted a BREXIT calamity if the UK voted to leave. Leave was the outcome and the question now posing is: were they right? Take a look at the last three months and the aftermath of the BREXIT vote.
BREXIT “doom and gloom” appears to be mostly exaggerated (so far)
For the first half of the year, we were warned early and often by authorities that the Brexit vote could be a calamity for the ages.
For example, the IMF claimed that a “Leave” result would threaten to “cause severe damage”, while Standard and Poor’s said that it would “paralyze” investment in the UK.
But, it turns out that the real Brexit casualty isn’t the UK economy – instead it is the reputation of the many professional economists who wrongly predicted doom and gloom as the likely aftermath.
THE STORY SO FAR
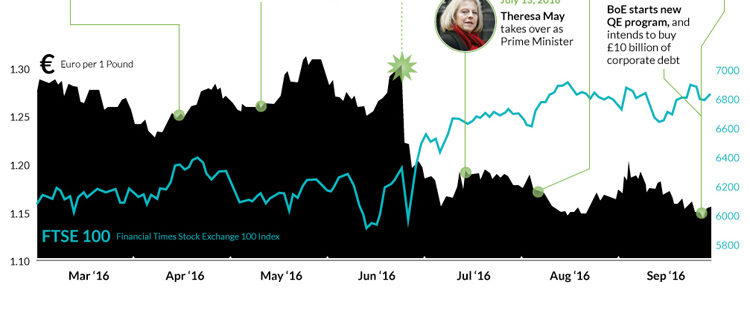
Today’s chart looks at the three months before and after the Brexit vote, which took place on June 23, 2016.
The two charts tracked are the GBP/EUR and the FTSE 100. The former is the price of the British pound in terms of euros, and the latter is a major stock index that includes the largest companies listed in London, such as Barclays, Glencore, HSBC, Royal Dutch Shell, or Sainsbury’s.
As expected, both markets have seen some action in the aftermath of the vote to leave. The pound has depreciated in terms of euros, but it is still higher now than it was from 2009-2011 in the post-crisis period. Against the ultra-strong USD, the pound is at decade-lows – but many other currencies are in similar territory as well.
The FTSE 100 is another story. It’s relatively close to all-time highs – and even despite the fears of a potential collapse of Deutsche Bank, it’s climbed over 12% since the initial Brexit slump.
In both cases, the action was partly underscored by the Bank of England, which announced a new stimulus program (QE) after its August meeting, while cutting rates from 0.5% to 0.25%.
OTHER INDICATORS
While there’s been movement in the currency and equity markets, other economic indicators have been status quo or better for the UK so far.
Retail sales beat in July and August, and unemployment remains at 11-year lows. Purchasing manager indices dropped temporarily, but jumped back up.
The economists that predicted that the sky was falling? They’ve been forced to revise growth expectations back up, at least on a short-term basis. It’s been dubbed the “Brexit Bounce” by The Spectator, a conservative magazine based in London.
While there is likely still going to be some long-term fallout from the Brexit decision, many “experts” blew it on this one.


